
Load Testing the Server Before Deploying Your Critical App
A presales war story about CPU steal time — the metric almost nobody checks before go-live — and the full stress-test checklist I now run before any app touches production.
A customer once told me, with total confidence:
“We’re ready. Load testing passed, QA signed off, we’re deploying Friday.”
I asked one question: “What VM size are you deploying on, and have you checked CPU steal time under load?”
Silence. Then: “What’s steal time?”
That Friday deployment went live. By Monday, response times had tripled during peak hours, support tickets were piling up, and nobody could explain why — CPU usage on the app server looked fine. Not maxed out. Not even close.
That’s the trap. CPU steal time doesn’t show up as high CPU usage. It hides in plain sight.
What CPU Steal Time Actually Is
If your app runs on a cloud VM — AWS, Azure, GCP, or any shared hypervisor host — your VM is not the only thing running on that physical server. Other customers’ VMs share the same physical CPU cores. The hypervisor decides, moment to moment, which VM gets CPU time.
Steal time is the percentage of time your VM wanted to run on the CPU but couldn’t, because the hypervisor gave that time to a neighbouring VM instead.
Here’s the part that trips people up: your VM’s own CPU usage metric only measures what happens inside your VM. It has no visibility into the time it spent waiting outside, in the hypervisor’s queue. So you can have an app server reporting 40% CPU usage, technically “healthy,” while it’s actually being starved of the CPU cycles it needs — and every request is slower because of it.
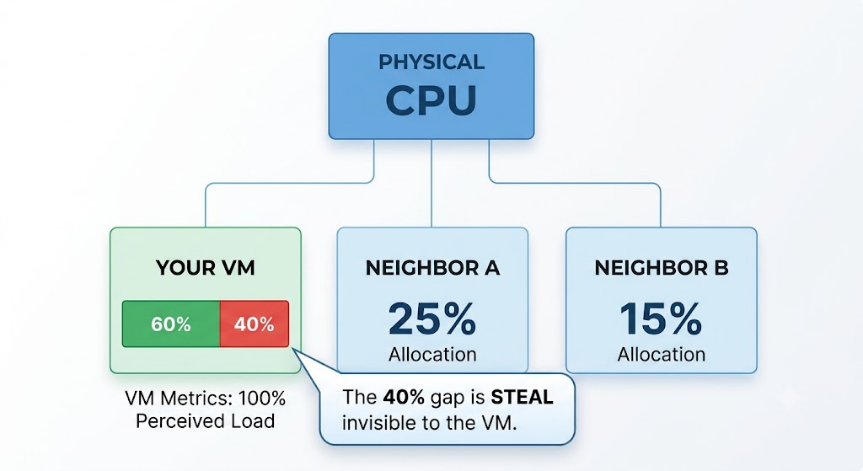
This is the classic “noisy neighbour” problem. It’s most common on:
- Burstable instance types (AWS T-series, Azure B-series) that are designed to be oversubscribed
- Cheap shared-core VPS plans
- Any host running close to capacity with many tenants
You can check it right now on a Linux box with:
topLook at the %st value in the CPU line. Anything consistently above 10% means your app is losing real CPU time to other tenants — and that number gets worse exactly when you need performance most: during your own traffic spikes, because that’s usually when everyone else’s spikes too.

top — nearly a quarter of this box’s CPU time is going to other tenants on the same host.Why This Never Shows Up in Normal Testing
Here’s why so many teams miss it. Load testing usually runs in a staging environment. Staging is often on a quieter host, provisioned separately, with little or no other tenant load. The app performs beautifully. Everyone signs off.
Production is a different host, possibly a cheaper tier, possibly shared with far more noisy tenants — and the first time anyone discovers the steal time problem is when real customers are already inside the app, complaining.
The fix isn’t complicated once you know to look for it:
- Check %st on the actual production instance type, not staging, under real load — not just idle.
- Move to dedicated-core instances (e.g. AWS m/c/r families instead of the t family) for anything customer-facing and latency-sensitive.
- Alert on steal time, not just CPU usage. Set a CloudWatch or Azure Monitor alarm on it. Most teams alert on CPU% and never even collect steal time as a metric.
- If you must use burstable instances, understand your CPU credit balance and what happens when it runs out — that’s a related but separate trap.
That customer from the story above moved their app server from a t3.medium to an m6i.large two weeks after launch. Steal time went from spiking above 30% during peak hours to a flat 0%. No code changed. The app was never the problem.
The Bigger Lesson: Steal Time Is Just One Item on a Longer List
CPU steal time is the one nobody checks. But it’s not the only thing that passes fine in staging and breaks in production. Here’s the full checklist I now walk through with every customer before a go-live date gets locked in.
1. CPU steal time (covered above). Test on the actual production instance family, under real concurrent load, not idle.
2. Check where your CDN edge actually is. If your site sits behind Cloudflare, the edge serving your visitors is not always in your country. When the edge sits in a different region from both your users and your origin, every request takes an international round trip, and page loads can slip by whole seconds. Open https://yourdomain.com/cdn-cgi/trace and compare colo= (the Cloudflare edge serving you) against loc= (your own location). If those two are far apart, you are paying that latency on every single asset.
3. Disk IOPS and latency. Cloud disks (EBS gp3, Azure managed disks, and so on) have provisioned IOPS and throughput caps. An app that writes logs, session data, or database records can silently queue up once it hits the disk’s IOPS ceiling — and the symptom looks like “the app is slow,” not “the disk is throttled.” Check your disk’s IOPS and throughput limit against what your app actually generates at peak load, not average load.
sudo fio --name=iops-test --directory=/root --size=1G --numjobs=4 --rw=randwrite --bs=4k --iodepth=32 --ioengine=libaio --runtime=60 --time_based --group_reportingIn plain words: this starts 4 parallel jobs, each writing its own 1 GB file into /root — 4 GB in total — in 4 KB blocks, and it keeps writing for 60 seconds. At the end it gives you a reading. Two numbers matter:
- IOPS — writes per second. You will see something like
iops: min=4749, max=448901, avg=31436.63. Judge the disk on avg — about 31,000 writes per second here. The min of 4,749 is the single worst sample: useful as a warning about how bad the dips get, but it is not the disk’s normal speed. - Latency — how long one write takes to finish. The value to read is clat, completion latency:
clat (usec): min=18, max=18354k, avg=5319.06. That max is 18,354,000 microseconds — over 18 seconds for a single write. An average of 5 ms is healthy; an 18-second outlier is something your app will feel.
4. Network bandwidth and connection limits. Cloud instances have a documented per-instance network throughput cap, and it usually scales with instance size — look it up on your provider’s spec sheet for the exact instance type going to production. To see what the box actually gets, install a speed test on it:
sudo snap install fastThen just type fast and hit enter. That gives you real download throughput from the server, which is enough to catch a box performing nowhere near its rated bandwidth. It will not tell you your concurrent connection ceiling, though — for that, check the limits on whatever sits in front of the app (load balancer, nginx worker_connections, database max_connections) against your real peak.
5. 502 / 504 gateway errors and the OOM killer. When the box runs out of RAM, or a sudden spike hits, Linux has no choice but to kill a process — and it goes for the one using the most memory, which is very often the database. The DB dies and restarts, and while it is coming back your workers and agents cannot open a connection to it. What you see at the front is a 502 or 504, which looks like a web server problem and is not.
dmesg -T | grep -i 'killed process\|out of memory'6. Autoscaling trigger behaviour. Don’t just confirm autoscaling is “enabled.” Test it. Push real load and watch the scale-out actually happen. Many teams discover, only during a real incident, that their scaling policy’s cooldown period is too long, or that the metric it scales on (CPU%) doesn’t reflect the real bottleneck — which, as above, might be steal time, disk, or connections instead.
7. Failure and degradation paths, not just the happy path. Kill a dependency mid-test. Cut off the database. Throttle the cache. A stress test that only proves the app is fast when everything works tells you nothing about what happens the moment one thing doesn’t — and in production, something always eventually doesn’t.
8. Third-party API rate limits. If your app calls out to a payment gateway, SMS provider, or any external API, confirm their rate limit against your real peak concurrent call volume. This is invisible in staging if staging uses a sandbox key with a different (often higher) limit than production.
What I Tell Every Customer Now
Before I sign off on any go-live date, I ask one question that covers most of this list in one shot:
“Have you load tested on the exact production instance type, at 2x your forecasted peak concurrency, while deliberately breaking one dependency at a time?”
If the answer is yes, they’re in good shape. If the answer is “we tested on staging and it was fine,” we’re not done yet — and now you know exactly what to go check first.
I write about the questions I ask in real customer rooms — the ones that change architectures and surface the problems no one else noticed. If you found this useful, drop your email below and I’ll send the next one when it’s ready.